Showing posts with label science. Show all posts

Sunday, 27 April 2014

Not-so-random post about randomness

One of the most common misconception about randomness is that it is often confused with uniformity.
Could you tell which is the most random distribution of dots between the two below?

which is random
Which is random? (click to enlarge)

The most common answer would be the one on the right, which is wrong. In fact, the pattern on the right is generated by applying a small wobble (or uncertainty) on an uniform distribution. The pattern on the left, instead, has been generated using a pseudorandom [1] number generator in BASH (details in this blog post). Randomness allows for "clumps" to form and it's because of those clumps that the unpredictable behaviour of randomness comes from (unless, of course, you know the "shape" of the random distribution a priori). This appears more clearly whenever we look at the distributions shown above in 1D rather than 2D:


random and uniform distribution
A random and an uniform distribution (click to enlarge)


It is clear that in the case of a uniform distribution, we have a greater level of predictability. Imagine you have a series of events which follows the uniform distribution. You are filling the histograms with events one by one by reaching 5000 events which recreate the distribution above. Whenever you approach higher numbers of events filled if there is a lack of events in one region of the histogram, there will be a higher chance for the next even to fall in that region.

You can picture in practice a 2D uniform distribution by imagining pouring a layer of marbles in a box, one by one. At the beginning their position will look random, because they can move around and take any possible position, but the fuller it gets the less available spaces there are and soon it will be easy to predict which are the only available spots for the next marble to go in.

The key thing is that whenever a position is occupied, it cannot be occupied again. This allows for a level of predictability, and this is not true of random distributions. Randomness is not predictable, its profile is unknown by definition, and it allows for the same position to be occupied again. This caused by the assumption that each random event is independent from the previous (Poisson process). Maybe this is also the reason why we believe uniform distributions to be "random". We are more familiar with those in practice and random events are either mostly abstract or harder to visualize.

This explains tendency of people to estimate randomness wrongly. This happens every time during lotteries. If a number has not come up for a long time, we feel that it is due soon. This is because we imagine random events as uniform. In fact, the probability of picking any number in a lottery is the same for every extraction, making all number equally probable to be picked, and not anyone more probable, because every extraction is independent from the previous.

An equivalent example is found in coin flipping. We feel that repeated head or tail events in a sequence of coin flips is a rare event. In fact, the chance of obtaining heads or tails is still 50% even after any number of heads have come up already. For example, events of the kind: THHTHTTHTTH and TTTTTHHHHH are equally as likely.

I created a computer-generated set of tosses to work out the frequencies of occurrences of repeated heads or tails (details on how this is done are in here). These are the results for 100000 occurrences of 15 tosses each:

 3 repetitions:  93894/100000
 4 repetitions:  64634/100000
 5 repetitions:  34667/100000
 6 repetitions:  16723/100000
 7 repetitions:    7789/100000
 8 repetitions:    3487/100000
 9 repetitions:    1584/100000
10 repetitions:     719/100000
11 repetitions:     332/100000
12 repetitions:     125/100000
13 repetitions:       53/100000
14 repetitions:       18/100000
15 repetitions:         7/100000

15 repetitions would mean having a full set of heads or tails, which seems impossible, but it happens 0.006% of the times. In fact, over 100000 occurrences, it happened 7 times. Close enough.

The data shows that three repetitions is an event which happens almost all the times, with four repetitions more than half of the times. Up to 6 repetitions, in fact, is not that much of an uncommon event. Almost half of the sequence! I am sure it would be hard to define "random" - in the common sense - anything which has more than 4 repetitions, although this simple test shows that it's almost the norm.

Another great example of how bad we are at understanding randomness is given by this small application at Nick Berry's DataGenetics. It will distinguish a randomly generated sequences of tosses (from a real coin) from the ones you made up yourself. It is not infallible, as it is based on the Pearson Chi-squared test (so it cannot always predict which is which) and after some trials it is easy to trick it to make it believe your sequence is random. Yet, I am sure it will give you a better understanding of randomness!


[1] I have used the word pseudorandom because every computer-generated programs simulates randomness. True randomness can only be found in some not completely understood natural phenomena. Being a simulation, there are different "qualities" of generated random numbers. I am not sure about the one used in BASH, but it is usually good to stick with a higher quality random number generator for more serious business (e.g. GSL)

Friday, 5 April 2013

Connection between derivative and integral

I remember that most of my struggle in understanding geometrical properties of calculus in first year undergrad classes was spent in working out why the integral is the inverse operation of derivative.

There are many mathematical proofs of this, which make perfect sense, but their connection is counter-intuitive as they perform seemingly different operations on curves. The derivative finds the slope at any point and the integral sums infinitesimal slabs of area under the curve. All derivatives can be solved analytically, while that is not true for integrals. Integration depends to an additive constant, while derivatives do not. Dissimilarities surely are numerous.

I have recently found this paper I wrote during my undergraduates in the quest to understand the geometrical origin of the connection between. Hope it is of any help to you, if you are having trouble in this like I had. I remember it made much more sense when I - very unrigorously - put it in this simple way:


P.S. for "Derivate" I mean "Derivative"

Tuesday, 25 September 2012

A picture of us all

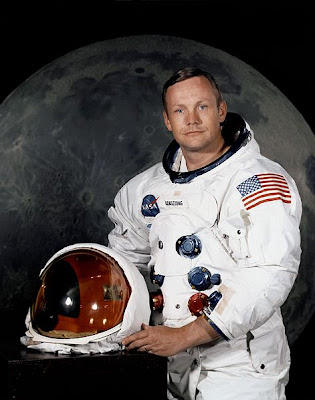
Neil Armstrong


The thing I like the most in writing science news is that the majority of the news is good news. Think of scientific research. It can only bring progress, and most of it is directed towards discovering things we can do and not things that we cannot do.

Sometimes, though, there are bad news. Exactly a month ago the first man that stepped on the moon died. A pioneer, or better, the pioneer of lunar exploration had complications after heart surgery and left us with one of the most remarkable achievements of humans, not just on the world, but on the universal scale. This is a gift not only appreciated by people in the USA, which launched the Apollo 11 expedition, but by the entire world, and consequently everyone mourned his death.

He did not like to be in the spotlight for his biggest achievement and he dropped his career as pilot (and astronaut) after his big mission. However, he did not stop from looking at the future as he started teaching in the University of Cincinnati in the department of Aerospace Engineering.

If you want to know more about his life, there are plenty of sources, and I would suggest you to do it, as it was a very interesting one, for sure, regardless of his longest trip.
What I am going to talk about here is about one of my favorite pictures of Neil:

Buzz Aldrin and a reflected Neil Armstrong, off the visor
Buzz Aldrin on the Moon. You really want to click on this picture to enlarge it.

You might be asking yourself if I it is a typo or not. And you are right, the most visible astronaut in the picture above is Buzz Aldrin, but if you zoom on his helmet's visor, you will notice a familiar reflection:


The visor picture
Zoomed-in visor showing reflections

And this landscape in the reflection is what makes me love this picture.
That is the reflection of Neil Armstrong, right in the middle, taking the picture of Buzz.

It is amazing to think about the trip photons had to undertake in order to form this picture. Coming from the sun, traveling through a distance of 149980571 kilometers, at around a billion km/h, roughly taking 8 minutes, to end up hitting Armstrong's suit.

In all the possible direction they could have been reflected (or absorbed, finishing their trip), they got reflected towards Buzz Aldrin's helmet. Instead of going through the visor, into Buzz's eyes, or (more rarely) being absorbed by the visor itself, they got reflected back exactly towards Neil. In particular, they got reflected towards his camera, and having passed the lens and all the components of the camera smoothly, finally they met their fate getting absorbed by the film, which is now letting us seeing the amazing pictures of men on the Moon.

But that is not all. There are at least other two amazing facts in this picture.

The first, being the "halo" around Buzz's shadow.
If you see the picture of the reflection from the visor, you will notice that the lunar grounds look lighter around Buzz's shadow. An interesting fact, which helps explaining the phenomenon, is that the halo of light is not seen in the original picture (unzoomed) where Buzz's shadow can be seen unreflected.

That is because it is an optical illusion, commonly called opposition effect. It does not just happen on the Moon, as seen here, but the high concentration of regolith on the moon increases the strength of the effect.
The opposition effect happens when the observer (or photographer) is pointing at the opposite direction of the light source (the sun). As regolith has high retroreflective properties, the zone which opposes the sun will reflect much more light and will then be brighter.
All of this, reflected back to us thanks to Buzz's helmet.

It was not just enough having Neil's reflection and a reflected opposition effect, as the picture includes something even more astounding.

Planet Earth, Home
Mankind in a shot

All of us are in the pictures as well, as the visor also reflects the Earth in the sky. Highlighted in the picture above, we are all there, on the pale blue dot. I can safely say that this is the only human-made picture which includes the whole of humanity (Michael Collins is in the module, which is also reflected by the visor, on the right) and in general, a picture which includes every living organism known to us.

I need to say it again: I love this picture, and I hope you can fully understand why, now. I will conclude with a touching quote about this very photo, from Buzz Aldrin, which can surely express better than me the beauty of this shot:

"As I walked away from the Eagle Lunar Module, Neil said 'Hold it, Buzz', so I stopped and turned around, and then he took what has become known as the 'Visor' photo. I like this photo because it captures the moment of a solitary human figure against the horizon of the Moon, along with a reflection in my helmet's visor of our home away from home, the Eagle, and of Neil snapping the photo. Here we were, farther away from the rest of humanity than any two humans had ever ventured. Yet, in another sense, we became inextricably connected to the hundreds of millions watching us more than 240,000 miles away. In this one moment, the world came together in peace for all mankind."
Buzz Aldrin - Apollo, Through the Eyes of the Astronauts

Wednesday, 12 September 2012

Of Einstein's genius

This man oozes brainpower. Maybe not in this picture, though.

The real genius in Einstein's work is in the fact that he discovered a fundamental property of the universe from only a few assumptions.
He set the speed of light as constant in different frames of reference and developed the mathematics of Lorentz transforms further to come up with one of the most beautiful theories in physics.

While usually in physics direct evidence and data is studied to deduce a phenomenon, he inductively derived his theory having no evidence at all. He made his own axioms and derived everything again from them. And the best part is that it worked, at least in theory. Despite a few physicist immediately recognized his genius, his theories were not completely recognized by the scientific community at the beginning, especially when the paper for his theory of Special Relativity presented no references. Einstein's reasoning was outside the lines, but sharp, nonetheless, and it proved no mistakes.

Evidences for his special theory of relativity started to come up only much later, around 1932, with the Kennedy-Thorndike experiment testing the dependence of the speed of light on the velocity of the measuring device.
Direct evidences of the general theory of relativity are still feeble, even though it is now a firmly accepted theory.

no it's not photoshopped
No, it is not photoshopped
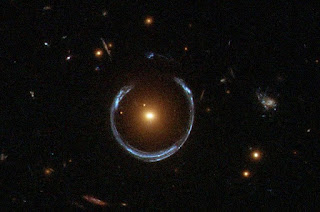
The difficulty in testing this theory (linked to the difficulty to discover it) lies in the fact that we need astronomically strong gravitational fields in order to detect the space-time fabric and its tiny ripples: the gravitational waves. I did not use the word astronomical by chance, as the best empirical evidences come from deep space. Usually quasars (active galactic nuclei), which are very far, but bright x-ray sources, are used as indirect test for the theory of general relativity, as their ginormous gravitational field can bend light. Pictures of galaxies behind quasars could be worked out from their light being bent right into our eyes (or telescopes), forming "rings" of light around the quasars.

A more direct evidence of general relativity would be detecting its evident result: gravitational waves. Unfortunately, these waves are far less energetic than anything we can imagine, making it easy to let them disappear into the much higher and chaotic background of radiation. Experiments exist trying to achieve the impossible through interferometers, but a much more concrete evidence, at least for now, is presented by binary pulsars.

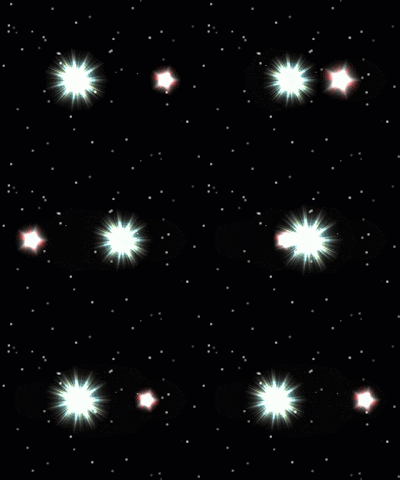
weeeeeeeeeee
Not the most scientifically
accurate gif I could find,
but surely the coolest.

Binary pulsars move into space and their gravitational field emits gravitational waves, which is a leak of energy from the system. Everything, in fact, emits gravitational waves, but for small (less heavy, to be precise) objects their emission is undetectable. As energy is leaking from the binary system of pulsars, their period of revolution will get slightly slower than usual and with enough time passed, this accumulated time will get significantly big to be measured. This is not a direct evidence, as the energetic leak that slows the period down is not necessary given by gravitational waves, but that is the only phenomenon we know that could cause it, for now, and Einstein's model works really well when applied to these bodies, so it is still evidence, even if indirect.

When I started writing this post, it was meant to be an introduction to one big recent news in science in one of the FSND series. I was so excited writing about how marvelous Einstein's theories are that it got too long and I decided that it would easily be a blog post on its own.

The news regards the recent first visible-light evidence of gravitational waves from a pair of dwarf stars, and I'll now leave you in a pointless cliff-hanger (pointless as the news is already out elsewhere) as I will talk about it in the next Fortnightly Science News Digest on 15 September.


Tuesday, 24 July 2012

How to balance two forks on a toothpick

I posted a video a while ago about balancing forks on the rim of a cup:


This trick can be easily made using just 2 forks, 1 stick and a glass.
Your eyes won't believe it, but physics laws have not been violated in the making of this video.


The physics behind it


The center of mass of the system (forks + stick) falls around the middle of the stick, which lies exactly on the pivot.

That is the most stable position giving then stable equilibrium. Even for small displacements the system is balanced by a restoring torque.

Moreover, the system remain balanced even if half of the stick is burned, because the missing weight of the burned stick is negligible with respect to the weight of the whole system, then the center of mass approximately stays in the same position as before.


How to make it


The making of follows three simple steps:

1.   Put a toothpick (or any stick that can stand the weight of two forks) between the teeth of a fork.

2.   Take another fork (of the same kind) and push its teeth between the ones of the first fork. This is the most difficult bit as most of the times, the two forks and the toothpick will not stick together (you could use glue at this point without making the trick pointless, but I managed to do it without glue).

3.   Put the structure on any edge, trying to find the point on which it will balance (no glue allowed at this point). You will find it by the pressure on your fingers while you try to do it. The point depends on the shape of the forks and in my case the centre of mass fell on the middle of the toothpick.

3b.   Impress your friends!


Monday, 9 July 2012

Higgsteria - How to interpret the mass spectrum graph

The seminar on the 4th of July held at CERN in Geneva - despite the use of Comic Sans font - gave very interesting news to the Physics community.

ATLAS and CMS, two experiments from LHC, both discovered a new particle (5-sigma level is a requirement for a discovery) at 126 GeV in the mass spectrum.

Jargon apart, if you are not a physicist, you can read info about the Higgs boson (such as what is the Higgs, what is a boson, how does it give mass to other particles...) pretty much everywhere nowadays.

What many people may wonder is: what is this 5σ? And what about this 95% confidence level (CL)? But, most importantly, what is 126 GeV?
In this post I will give you an idea, with simple language, about these concepts and you will be finally able to understand this (not-so) mysterious graph.


Thursday, 28 June 2012

Natural selection and prime numbers

The adults [of periodical cicadas] live for a few weeks, but the 'juvenile' stage (technically 'nymphs' rather than larvae) lasts for 13 years (in some varieties) or 17 years (in other varieties). The adults emerge at almost exactly the same moment, having spent 13 (or 17) years cloistered underground. Cicada plagues, which occur in any given area exactly 13 (or 17) years apart, are spectacular eruptions that have led to their incorrectly being called 'locusts' in vernacular American speech. The varieties are known, respectively, as 13-year cicadas and 17-year cicadas.
Now here is the really remarkable fact. It turns out that there is not just one 13-year cicada species and one 17-year species. Rather, there are three species, and each one of the three has both a 17-year and a 13-year variety or race. The division into a 13-year race and a 17-year race has been arrived at independently, n fewer that three times. It looks as though the intermediate periods of 14, 15 and 16 years have been shunned convergently, no fewer than three times. Why? We don't know. The only suggestion anyone has come up with is that what is special about 13 and 17, as opposed to 14, 15 and 16, is that they are prime numbers. A prime number is a number that is not exactly divisible by any other number. The idea is that a race of animals that regularly erupts in plagues gains the benefit of alternately 'swapping' and starving its enemies, predators o parasites. And if these plagues are carefully timed to occur a prime number of years apart, it makes that much more difficult for the enemies to synchronize they own life cycles. If the cicadas erupted every 14 years, for instance, they could be exploited by a parasite species with a 7-year life cycle. This is a bizarre idea, but no more bizarre than the phenomenon itself. 

Richard Dawkins - The Blind Watchmaker

Monday, 18 June 2012

Why scientists will never be popular


There's things that will never change, and one of them is here right in front of our eyes.

I know the news is a bit old, but I've bumped on this link which I saved in my favourites a while ago:

http://www.google.com/trends/?q=scarlett+johansson&ctab=0&geo=all&date=ytd&sort=0

I am curious by nature and I love interpreting data, then one of my favourite services of Google is of course, Google Trends. But this search shows something obvious to any reader. The amount of queries for "scarlett johansson" was ridiculously increased when there was the news that her nude pictures taken from her phone by some hacker and published over the internet. Then, it went back to almost normal after a few days (when people obtained the pictures or could not manage to get them).

I've found this particular search query so incredibly relevant to easily explain two problems:

-   Science will never be popular between the general public, as it is clear that people are interested in something else: porn. And all that comes with it, from nude pictures to light gossip between celebrities. If you ask people to name who won the Academy Awards in 2009 I am sure you'll get more right answers than asking who won the Chemistry Nobel prize in 2009. I can't even name anyone who won the ducking Nobel prize that year, figure how well would do someone not involved in science.

-   Never consider anything on your happily connected-to-the-internet smartphone as safe. If people wanted it, they could easily get something you consider private and share it. And don't think that legal actions will make you justice, as Ms. Joahnsson desperately tried. Anything which is (or has been) on the internet once, is public forever.
Oh, and if you use facebook on your mobile, everything in it is property of facebook, anyway.

Sunday, 10 June 2012

The eye's complexity


The light-sensitive cells ('photocells') are not the first thing the light hits, but they are buried inside and facing away from the light [...]. The first thing the light hits is, in fact, the layer of ganglion cells which constitute the 'electronic interface' between the photocells and the brain. Actually the ganglion cells are responsible for preprocessing the information in sophisticated ways before relaying on it to the brain and in some ways the word 'interface' doesn't do justice to this. 'Satellite computer' might be a fairer name. Wires from the ganglion cells run along the surface of the retina to the 'blind spot', where they dive through the retina to form the main trunk cable to the brain, the optic nerve. There are about three million ganglion cells in the 'electronic interface', gathering data from about 125 million photocells. [...] As you look at the fine architecture of the photocell, keep in mind the fact that all that complexity is repeated 125 million times in each retina. And comparable complexity is repeated trillions of times elsewhere in the body as a whole. The figure of 125 million photocells is about 5,000 times the number of separately resolvable points in a good-quality magazine photograph. The folded membranes on the right of the illustrated photocell are the actual light-gathering structures. Their layered form increases the photocell's efficiency in capturing photons, the fundamental particles of which light is made. If a photon is not caught by the first membrane, it may be caught by the second, and so on. As a result of this, some eyes are capable of detecting a single photon. The fastest and most sensitive film emulsions available to photographers need about 25 times as many photons in order to detect a point of light.

Richard Dawkins - The Blind Watchmaker

Monday, 30 August 2010

5 "must-see at least once in a lifetime" Celestial events

Most of the travellers choose their destinations based on the wonders of the world. Some of them, choose them for the wonders of the universe.

There are some beautiful celestial events that are visible only on certain locations on Earth at certain times. Their rarity and poor availability, combined with their beauty, drives people to travel to be able to see them.

Here is a list of 5 events worth seeing at least once in a lifetime. For each one of them I wrote a blog post on their nature and how and when to find them:

  1. Aurorae
  2. Solar Eclipse
  3. Midnight Sunset
  4. Milky Way
  5. Meteor Shower

Enjoy.

1. Aurora

Aurorae

Aurorae are one of the most impressive views of a night sky and they are very famous to be an event that not all the skies can host.
They happen around the polar regions, both in the northern and southern hemisphere taking respectively the more common name of northern and southern lights.
The curvy movements and the lightness with which they fly across the sky is a really hypnotizing and fascinating sight that cannot leave even the most apathetic man without a "wow" out of his lips.

[This is a post which is part of the series: 5 unmissable celestial events]

Monday, 23 August 2010

2. Solar Eclipse

Anular eclipse at sunset

Solar eclipses are natural phenomena that occur when the Moon passes between the Earth and the Sun, obscuring the latter.
This event is so unnatural that it astonishes and amazes not just humans, but many others living creatures. Studies have shown that animals react strangely to solar eclipses. Their behaviour is driven by the absence of sunlight where there should be and, in fact, depending on the animal, they usually prepare to sleep.

 [This is a post which is part of the series: 5 unmissable celestial events]

Monday, 16 August 2010

3. Midnight Sunset

Midnight Sun

The midnight sun is a quite surreal phenomenon happening in very northern or southern latitudes, nearby the polar regions. It is nothing more than having the sun out in the sky, only, at midnight!
What is stunning, though, is that (it depends on the latitude and the season) the sun does not set, but remains still on the horizon before rising again and giving sleepless "nights" to visitors.

 [This is a post which is part of the series: 5 unmissable celestial events]

Monday, 9 August 2010

4. Milky Way

milky way, our galaxy

A starry sky is always a very relaxing and touching view, and often, if we spend some time to contemplate it, when our eyes are well adapted to darkness, we could spot some steady "white clouds" between the stars.
Fortunately that is no premonition of rain, because those clouds are well beyond the Earth's atmosphere. That is the Milky Way, no less than the very galaxy we live in!

[This is a post which is part of the series: 5 unmissable celestial events]

Monday, 2 August 2010

5. Meteor Shower

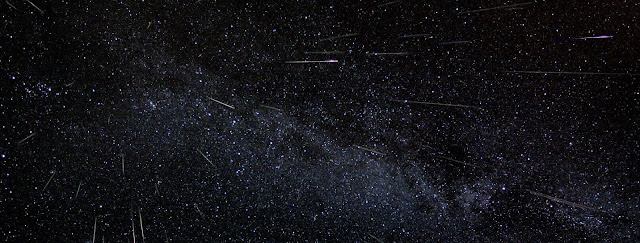
meteor shower

Seeing a falling star is a peculiar event. Its rarity permitted the birth of the popular conception of expressing a desire when seeing one. But maybe this habit founds more solid roots in the fact that people nowadays spend a very little time looking at a night sky, than on the rarity of the event itself.
Millions of meteoroids are in orbital collision with the Earth every day and we should thank our atmosphere that only a tiny percentage reach the ground with much smaller sizes than the original object. On certain seasons the frequency of falling meteors is so high that the event is called meteor shower. But why the Earth is tormented by these intruders?

 [This is a post which is part of the series: 5 unmissable celestial events]

Thursday, 20 August 2009

Shower

Having a shower is a relaxing moment of the day. Some people sing, others just imagine, but whatever you do, the mind is surely free to think about anything and fly (freely) over a lot of disparate topics, often non-related between each other.

I don't know how, but when I was showering, today, I happened to think about an awesome quotation from Tanenbaum (besides, a Physics doctorate and one of the man that "triggered" Linus Torvalds to write his famous UNIX operative system):

Never underestimate the bandwidth of a station wagon full of tapes hurtling down the highway.

What's so interesting about this expression?
Even if it has been used in 1981 on a different context, its irony could still be up to date, since Sneakernet is a still very common practice and couldn't (still) be easily substituted by virtual data transfers (p2p, ftp...).
I've heard new versions of this quote with "hard disks" instead of "tapes", indeed.

The next step on my train of thoughts - during the shampoo - was the realization that I can calculate the actual bandwidth, a kind of average in kb/s, of a car bringing an hard disk.
How? Dimension analysis, obviously!

The dimensions of velocity are: [Length] / [Time] , so to obtain the dimensions of bandwidth [Data] / [Time] it is just necessary to multiply by the data carried and divide by the distance covered.
The result is a formula for the bandwidth depending on velocity of the car v, the distance travelled l, and the data carried d.
${b = \frac{v \cdot d}{l}}$
(if you see incomprehensible signs enveloped by dollar signs, Latex script is not working properly)

If we pick a car travelling a distance of 1000 km at 130 km/h carrying a Terabyte:

${b = \frac{130}{1000}\,TB/h \sim 133\,GB/h \sim 38\,MB/s}$

Quite satisfying.

This is useful (maybe not) but it's not finished.
If you can calculate the bandwidth of a bunch of data travelling in a car, why don't we calculate the velocity of a bunch of data travelling through the wires knowing the bandwidth?
In this case data should be considered like a solid packet, and d is the distance between the host and the server. After some easy math:

${v = \frac{b \cdot l}{d}}$

Wow, you're still reading... crazy. Anyway, that's not all, not yet:
if you pick a value for d (data) smaller than b (bandwidth), it almost doesn't make any sense and the result could be a velocity higher than the speed of light, indeed.
Since the speed of light is an upper limit:

${v = \frac{b \cdot l}{d} \leq c}$

and so:

${b \leq \frac{d \cdot c}{l}}$

that is the absolute upper limit in bandwidth.
If we put numbers, the result still doesn't make any sense.
For example, since the net works in small packets, for a 64 byte packet from a server 7000 km far, the upper limit speed is about 2.7 kb/s.
This result could be useful if we make a small modification to find the time required to transfer that packet at c (dimension analysis again):

${t = \frac{d}{b} = \frac{64\,byte}{2.7\,kb/s} \sim 0.02\,s}$

That is 20 milliseconds: the lowest time physically possible needed to receive something from a distance of 7000 km.
Real timings are about 150ms for good servers, to send and receive, so about 75ms one way, that is in the limits...

Now I ended the shower and then also this small trip around physics and the internet. The result of this brainstorming thoughts? I really don't know, but I still like it.

100 points for the first who analyse relativistic effects on the packets and find how much kilobytes the file loses travelling at that speeds.

Friday, 31 July 2009

Moonset and Jupiter again

Same telescope as in the previous post, different situation: waxing moon.
After some time wasted (the temptation to point the telescope to the ground and spy innocent people from the top of my house is unimaginable) I convinced myself to watch the orange setting moon a little nearer (20mm eyepiece):

The setting moon, through telescope
 

And after I proved that Jupiter's moons (obviously) move and then (indirectly) that gravitational laws are true. As you can see in the pictures below, with the same telescope (20mm eyepiece) the moons have a different configurations and it agrees with Stellarium. (mouse rollover to circle the moons):


Stellarium (mouse rollover to name the moons):


Wednesday, 29 July 2009

I've seen what Galileo saw

Clear sky, Tramontana (a Northern wind known to be very dry in Southern Italy), new moon, neighbourhood lights off: perfect occasion to dust off my brother's telescope and do some night-sky observations.

A refracting telescope, 10cm objective lens and two 34mm and 20mm eyepieces; not so bad for the Moon and planets.

I tried to spot some stars but they were too faint because of that damn light pollution, so I decided to see one of the most luminous astral bodies in the Northern Sky: Jupiter.
After some focusing, I spotted Jupiter with its prominent lighter-hued zones.
But I also noticed what at first sight I thought were some refractions/reflections. There were smaller dots aligned near Jupiter, with different brightness. They were too strange to be some optical effect, so the second assumption was: the Jupiter's moons!
That dots were quite far from Jupiter, in my opinion, to be its moons so I wasn't so sure about that, but they were four (as the Galilean moons), aligned and with different sizes.
I took a picture with my phone (one of the most difficult things in my life, but I was determined to take it) and the result is a very fuzzy and dirty image. Unfortunately the view through the telescope was much clearer and defined, but it can get the idea across (click on the image to enlarge):

Jupiter and its four Galilean moons, from telescope


After reversing and some photoshopping (or better "gimping"):


Jupiter and its four Galilean moons, from telescope, now highlighted


Then I immediately checked with Stellarium what kind of bodies they could be, whether Jovian moons or stars. This is the screenshot:

Stellarium view of Jupiter and its Galilean moons, corresponding to reality!


Fascinating.

Stellarium: night sky simulation software


Stellarium, for linux
Exploring the educational section of softwares for Gnome, I stumbled upon this incredible program: Stellarium.

You just enter your location and it simulates the sky over you at that moment. Very useful for amateur astronomers or night sky passionate.

There are also a lot of cool features to make the sky similar to the real sky: you can regulate the magnitude and the light pollution, or you can accelerate or choose the time, you can label costellations, stars or nebulae (so you can learn star's names or costellations), make zooms and a lot more.

Practical, easy to use and interesting.
It is also available for Windows.